As promised, I've finally got started on making this somewhat cleaned MLS database organized for others to use. It still needs work and I'll be updating it over the summer so let me know if there's something specific you'd like to have or need explained in a readme file I haven't yet written. Most of the older stats came from the kindness of Chris Edgemon, who scraped the original data from MLS's sites. If you're looking for an interactive online database for stats and don't need seasons after 2014, you should just go to his site.
Chris told me of some known errors in the data set and that's what I've spent the last couple years combing through. I also added more information such as whether or not a goal scored in minute 46 was the first minute of extra time in the first half or the first minute of the second half. My database also has information on Generation Adidas Players, Designated Players, homegrown players, and salaries. So if you're looking for something to import into Stata, R, etc., then this database is for you.
I don't have an official website yet to host the database so I'm linking it to an online drive. Turns out, websites cost money. Of course if the clunkiness of blogger.com and google drive offends you enough to throw money at me, I'll make it go away and replace it with a nice looking site to host the data. If not, enjoy the data and please let me know if you find errors or have suggestions.
Click here for access to the folder that has the SQL database as well as the separate CSV for those of you that have as much trouble as I do getting SQL databases to "open" or "connect" or whatever it is they're supposed to do when other people who are not me use them.
Friday, June 16, 2017
Thursday, January 19, 2017
Holy break between posts Batman! Do not take the absence of posts as a sign of giving up. I've actually been working on the shootout idea formally and presented the paper at the North American Association of Sports Economists (NAASE) meeting (which is a subset of the Western Economic Association International meeting) in Portland a few weeks back. You can see the working paper, among others, here.
For this post, I want to walk through the last thought I had posted about the MLS shootout years. I predicted that the shootout should have caused less games to end regulation in a tie and had decided to estimate the shootout era's effect on the likelihood of games ending regulation in a tie using a logit model. The logit model estimates parameters when the dependent variable takes only two values. For our purpose of estimating the likelihood of ties, this works well as our independent variable can be expressed as 0 for games that did not end in a tie, and 1 for those that did.
Mathematically, the probability that game i ends in a tie is modeled as


Now when we do this, we have to choose values for all the other control variables in x since they will be in the equation. We could choose them to be anything but here it makes sense to set the difference in goal differentials between the two teams to be zero. This causes the effect to be calculated for a game contested between two equally strong teams. I also chose the interconference indicator to be zero but this has little effect since its coefficient was not significant. The estimated effects of the shootout and overtime eras are in the table below.

For this post, I want to walk through the last thought I had posted about the MLS shootout years. I predicted that the shootout should have caused less games to end regulation in a tie and had decided to estimate the shootout era's effect on the likelihood of games ending regulation in a tie using a logit model. The logit model estimates parameters when the dependent variable takes only two values. For our purpose of estimating the likelihood of ties, this works well as our independent variable can be expressed as 0 for games that did not end in a tie, and 1 for those that did.
Mathematically, the probability that game i ends in a tie is modeled as
where P is the probability that the game ended regulation in a tie and x contains all game-level attributes including the era the game was played under (shootout, overtime, or current era), an indicator for interconference games, and the difference in the season goal differentials between the two teams to measure relative team strength. The Stata code to estimate the model is here and the data is here (I'm working on figuring out how to do this in R for those that don't have access to Stata).
Unlike Ordinary Least Squares (OLS) coefficients, we cannot take the "beta hat" on the shootout indicator variable as the effect of the shootout era on the probability that the game ended regulation in a tie. Here, the effect of the shootout era is measured by the difference in probability when the shootout indicator is 1 and when it is 0, holding constant all other variables. That is, we ask what is the probability of a game ending in a tie in the shootout? Then ask, what if we played the same game without the shootout rules? Whatever the difference in likelihood of tying is between the two scenarios is what we deem to be the shootout effect. Mathematically, this is just
Now when we do this, we have to choose values for all the other control variables in x since they will be in the equation. We could choose them to be anything but here it makes sense to set the difference in goal differentials between the two teams to be zero. This causes the effect to be calculated for a game contested between two equally strong teams. I also chose the interconference indicator to be zero but this has little effect since its coefficient was not significant. The estimated effects of the shootout and overtime eras are in the table below.

The second column shows how much each era changed the likelihood of any game between equally strong teams in the same conference ending regulation in a tie. The shootout era is estimated to have decreased the likelihood of games ending in regulation in a tie by 5.13% while the overtime era is estimated to have decreased regulation ties by about 1.65%. However, only the marginal effect of the shootout is estimated with any significance. That is, the small negative effect estimated for the overtime era may just be due to chance and the actual effect may be zero. The single star on the shootout coefficient means that the p-value was less than .05 or that we are at least 95% confident that the true effect of the shootout on the likelihood of tying is not zero.
The purpose of the shootout and overtime rules were to make the game more exciting for American fans. Although we didn't think much of the shootout as fans, golden goal overtime is undeniably an exciting way to end a match. The video below of Eddie Gaven's golden goal (after a shady substitute as a keeper...more on that in a future post) is great evidence of the excitement. Just listen to the announcer's voice crack when Tim Howard saves a potential game winning goal and again when Gaven scores.
The purpose of the shootout and overtime rules were to make the game more exciting for American fans. Although we didn't think much of the shootout as fans, golden goal overtime is undeniably an exciting way to end a match. The video below of Eddie Gaven's golden goal (after a shady substitute as a keeper...more on that in a future post) is great evidence of the excitement. Just listen to the announcer's voice crack when Tim Howard saves a potential game winning goal and again when Gaven scores.
To test the effect of the overtime golden goal rule on the likelihood of ties
including overtime, I re-coded the tie variable to be 1 for the overtime
era games only if that game ended overtime in a tie. That is, if a game
ended with a golden goal, I did not count it as a tie. Of course I
could not recode the shootout games in a similar manner since all
shootouts ended with a winner. After presenting this research at the NAASE conference, I realized that I should have just left out the shootout games but for
now I leave the results estimated as is.
The estimates in the first column suggest that when not counting games ending in golden goal overtime as tied, the overtime era actually decreased the likelihood of ties by almost 10%! Since we did not pick up a significant effect in regulation, this means that all the decrease in ties were due to super exciting (or heartbreaking depending on your loyalties) golden goals scored in overtime. Clearly, the policy worked as planned. Whether or not the fans beyond myself preferred games to be ended this way remains to be tested.
Wednesday, August 24, 2016
Quick Thoughts on MLS Attendance
Today I saw a tweet from @TotalMLS showing the average attendance of MLS in 2016 thus far. Along with other twittazens, I wondered what the rankings would look like in terms of population and stadium capacity. I recreated the histogram using Excel below for comparison. I would like to note that every time I have to use Excel or Word I die a little on the inside so I hope someone finds this useful.

The usual comments and questions that come up after seeing attendance numbers are things like
- Seattle invented attendance! Let our capo come to your town and show you how to do it.
- Why is team X so terrible and why doesn't the league move team X to my city Y?
- Of course your big city team has great attendance; you have a billion people.
- My stadium doesn't even hold that many people.
- The poor attendance is because the stadium is far from the city.
While I refuse to even acknowledge the first two points, the last three we can at least start to investigate. Below is the average attendance numbers expressed as a percent of each team's stadium capacity. I see this as a short-run test of the front office's ability since they are at least temporarily stuck with their capacity.

Kudos to San Jose, Sporting Kansas City, and Montreal, who are defying reality and filling up their stadium beyond capacity. Having never visited these stadiums, my guess is this means they sold all their seats and had "standing room only" type tickets as well. Portland is hitting 100%, which may not be surprising since the stadium has, as far as I know, the best atmosphere in MLS. It is a little surprising, however, since I was at the inaugural game this season and noticed empty seats. Maybe some fans were walking around. Maybe teams are back to reporting tickets distributed and not butts in seats. Who knows?
Looking at the teams with the most issues filling up their stadiums, the bottom 6 all reside in football stadiums whose capacity is artificially restricted to prevent the fans from feeling like their in a mostly deserted fish bowl. I attended Rapids games at Mile High stadium when there was less than 5,000 people in a 76,000 capacity stadium. No matter how much you love soccer that's just not fun. The percents here do not use the artificial capacity because that would be cheating. These teams are 4 of the top 6 when it comes to average attendance and occupy the top 3 spots. So not only do they (outside of DC) have the best attendance in MLS, they have much room to grow.
The teams not packing their stadiums and selling less than 80% probably have some work to do. I'm going to throw Columbus and Colorado on the problem list as well because I don't believe Colorado's attendance numbers and Columbus somewhat cheated by replacing its north end seats with a stage thereby reducing its capacity. So let's look at what percent of each team's metropolitan area population (2016 July population from the U.S. Census and 2015 population from Stats Canada). This is a more long-run test of success since stadium size is a choice but your metropolitan area population is not.

RSL is killing it. The smallest market in MLS is getting the largest proportion of residents to cheer on its team. Is this due to the lack of sports entertainment competition? RSL only compete with the Jazz in professional sports so that may be part of the story. Cynical urbanophiles will say it's because there's nothing else to do in Salt Lake but these concrete jungle types have no idea just how many ways there are to be entertained in the beautiful Rocky Mountain Region.
The lack of professional sports competition is common among many of the other top teams (ORL, SEA, SJ, POR, VAN, CLB) while the abundance of other sports and entertainment options are clearly part of the story for the bottom dwellers located in NY/NJ, Chicago, and Los Angeles. So who is doing poorly no matter which way we slice the data? My unofficial list of troubled front offices would include
- Dallas
- Chicago
- DC
Sunday, January 31, 2016
"Any given Sunday"
Back in September, I made the case that MLS was more of an any-given-Sunday league than perhaps the NFL. I did so using methods from sports economics journals that are kind of statistics-heavy for the average reader. Some have commented to me that my posts are a bit too technical but...that's the point! However, I wanted to provide evidence that everyone can digest via an infographic. And by the grace of graphic designer Todd Mason, I give you your evidence that MLS is indeed a league where anyone can beat anyone.


Wednesday, December 16, 2015
MLS Begins Era of Free(er) Agency
After taking
a long firm stance against free agency, has MLS finally caved and given the players what they've been fighting for? Sort of. Although the players who qualify for free agency are indeed free to sign a contract with any team, the league has placed strict limits on the amount a player's salary may increase. In other leagues such as Major League Baseball, players who reach free agency can see their salaries more than double for an annual increase in the millions. This is exactly what MLS wants to avoid.
Expensive Pennies
I'm hoping the wording in the union's press relesase is poorly chosen and that the percent caps on salary increase are actually on a sliding scale. Otherwise, a player like Chad Barrett listed below makes a penny too much at exactly $100,000. At that salary, if Chad were eligible for free agency, he could only negotiate a salary of $100,000*1.2 = $120,000. However, if he made a penny less, he could negotiate a 25% increase in salary, $99,999.99*1.25 = $124,999.99. That last last penny could potentially be costing him $4,999.99! The drop in max salary is even worse for someone like Bobby Boswell who made exactly $200,000. He can negotiate for a salary up to $200,000*1.15 = $230,000 but if he made only a penny less, could negotiate up to $199,999.99*1.2 = $239,999.99 or $9,999.99 more! Again, since the collective bargaining agreement is not yet posted on the players' union site, we cannot be 100% certain that this is how the system works but according to the union's press release, these odd drops exist.
Interesting Incentives
Assuming the situation is exactly as laid out in the players' union press release, there are some interesting incentives introduced with this flavor of free agency. There are seemingly two salary ranges where a player could potentially negotiate a higher salary in the future if he were actually paid less in the current season; the ranges $96,000 to $99,999 and $191,667 to $199,999 shown below.

Consider a soon-to-be free agent whose salary is just below either cutoff shown above. His team has an incentive to increase his current salary past the cutoff point. Doing so would give the team more bargaining power later as potential suitors would not be able to increase the player's salary as much. It may also save the team considerable money in the future if they retain the free agent.
Free Agents, Potential Free Agents, and Mike Magee
According to mlssoccer.com, there are 27 players listed as potential free agents. However, there are many more who satisfy the age, MLS experience, and salary restrictions. Since contract information is not publicly available, I assume those that weren't listed as free agents are currently under contract. Since soccer contracts are usually not many years long, it is likely that these players can be free agents relatively soon. Below is the list of potential free agents I've compiled from MLS player data from mlssoccer.com (which removed all but 2 of the players on the free agent list from the stats page!) and the 2015 salaries according to the players' union along with some notes. MLS announced free agents are in bold at the top. Potential free agents (conditional on being out of contract) are below and not in bold.
| team | player | age | season | guaranteed_salary | max_potential_salary | 2016 FA |
|---|---|---|---|---|---|---|
| CHI | Jeff Larentowicz | 32 | 11 | 271,000 | 311,650 | signed LA |
| CHI | Jon Busch | 31 | 9 | 90,000 | 112,500 | (NASL-IND) |
| CHI | Ty Harden | 31 | 8 | 75,078 | 93,848 | FA |
| COL | Bobby Burling | 31 | 9 | 140,000 | 168,000 | FA |
| COL | Drew Moor | 31 | 11 | 270,500 | 311,075 | signed TOR |
| COL | James Riley | 33 | 11 | 83,750 | 104,688 | FA |
| COL | Michael Harrington | 29 | 9 | 130,000 | 156,000 | signed CHI |
| COL | Nick LaBrocca | 31 | 9 | 180,000 | 216,000 | FA |
| FCD | Stephen Keel | 32 | 11 | 60,000 | 75,000 | FA |
| HOU | Nathan Sturgis | 28 | 10 | 75,375 | 94,219 | FA |
| HOU | Ricardo Clark | 32 | 11 | 337,750 | 388,413 | resigned HOU |
| LA | Alan Gordon | 34 | 11 | 175,000 | 210,000 | signed LA |
| LA | Edson Buddle | 34 | 14 | 106,250 | 127,500 | FA |
| MTL | Kenny Cooper | 31 | 9 | 285,625 | 328,469 | FA |
| NYCFC | Ned Grabavoy | 32 | 12 | 215,000 | 247,250 | signed POR |
| NYRB | Kyle Reynish | 32 | 8 | 90,317 | 112,896 | FA |
| ORL | Corey Ashe | 29 | 9 | 189,750 | 227,700 | signed CLB |
| ORL | Eric Avila | 28 | 8 | 77,000 | 96,250 | (MX -Santos) |
| PHI | Brian Carroll | 34 | 13 | 150,000 | 180,000 | signed PHI |
| PHI | Conor Casey | 34 | 9 | 180,000 | 216,000 | signed CLB |
| POR | Andrew Weber | 32 | 11 | 60,000 | 75,000 | FA |
| SEA | Chad Barrett | 30 | 11 | 100,000 | 120,000 | signed SJ |
| SEA | Troy Perkins | 34 | 10 | 136,663 | 163,995 | retired |
| SJ | Khari Stephenson | 34 | 8 | 71,646 | 89,557 | FA |
| SKC | Paulo Nagamura | 32 | 11 | 230,000 | 264,500 | signed SKC |
| MTL | Justin Mapp | 31 | 15 | 199,225 | 239,070 | signed SKC |
| CHI | Patrick Nyarko | 29 | 8 | 215,750 | 248,113 | |
| CLB | Tyson Wahl | 31 | 11 | 99,667 | 124,583 | |
| COL | Marc Burch | 31 | 11 | 110,000 | 132,000 | |
| COL | Sam Cronin | 29 | 8 | 202,500 | 232,875 | |
| DC | Bobby Boswell | 32 | 11 | 200,000 | 230,000 | |
| DC | Chris Rolfe | 32 | 10 | 225,000 | 258,750 | |
| DC | Davy Arnaud | 35 | 14 | 212,500 | 244,375 | |
| DC | Fabian Espindola | 30 | 9 | 175,000 | 210,000 | |
| DC | Sean Franklin | 30 | 8 | 234,167 | 269,292 | |
| FCD | Atiba Harris | 30 | 11 | 130,000 | 156,000 | |
| FCD | Chris Seitz | 28 | 9 | 130,000 | 156,000 | |
| HOU | David Horst | 30 | 8 | 81,500 | 101,875 | |
| LA | Dan Gargan | 33 | 12 | 125,000 | 150,000 | |
| LA | Dan Kennedy | 33 | 8 | 233,000 | 267,950 | |
| LA | Robbie Rogers | 28 | 8 | 191,667 | 230,000 | |
| MTL | Dominic Oduro | 30 | 13 | 251,667 | 289,417 | |
| MTL | Eric Kronberg | 32 | 10 | 132,000 | 158,400 | |
| NE | Brad Knighton | 30 | 8 | 82,005 | 102,506 | |
| NE | Chris Tierney | 29 | 8 | 113,333 | 136,000 | |
| NYCFC | Chris Wingert | 33 | 13 | 215,000 | 247,250 | |
| NYCFC | Jason Hernandez | 32 | 11 | 185,000 | 222,000 | |
| NYCFC | Josh Saunders | 34 | 10 | 90,000 | 112,500 | |
| NYCFC | Mehdi Ballouchy | 32 | 13 | 83,250 | 104,063 | |
| NYRB | Dax McCarty | 28 | 11 | 262,500 | 301,875 | |
| PHI | Sebastien Le Toux | 31 | 8 | 285,228 | 328,012 | |
| POR | Jack Jewsbury | 34 | 13 | 137,500 | 165,000 | |
| POR | Nat Borchers | 34 | 11 | 245,000 | 281,750 | |
| POR | Will Johnson | 28 | 9 | 334,333 | 384,483 | |
| RSL | Jamison Olave | 34 | 8 | 300,000 | 345,000 | |
| RSL | Javier Morales | 35 | 9 | 300,000 | 345,000 | |
| RSL | Nick Rimando | 36 | 16 | 370,000 | 425,500 | |
| RSL | Tony Beltran | 28 | 8 | 205,950 | 236,843 | |
| SEA | Brad Evans | 30 | 9 | 302,666 | 348,066 | |
| SEA | Chad Marshall | 31 | 12 | 291,667 | 335,417 | |
| SJ | Marvell Wynne | 29 | 11 | 200,625 | 230,719 | |
| SJ | Quincy Amarikwa | 28 | 10 | 100,000 | 120,000 | |
| SJ | Shea Salinas | 29 | 8 | 148,333 | 178,000 | |
| SJ | Steven Lenhart | 29 | 8 | 159,083 | 190,900 | |
| SKC | Chance Myers | 28 | 8 | 195,000 | 234,000 | |
| SKC | Jacob Peterson | 29 | 11 | 130,375 | 156,450 | |
| TOR | Herculez Gomez | 33 | 8 | 261,000 | 300,150 | |
| VAN | Jordan Harvey | 31 | 11 | 150,000 | 180,000 |
You may notice that I left off Mike Magee. Although he's included on mlssoccer.com's list, his guaranteed salary was above the maximum so according to the rules listed on the players' union website, he's not eligible. EDIT: and yet he was just announced as a free agent signing with LA! MLS isn't known for following it's own rules but there may be an explanation for this. It may be that allocation money was used to "pay down" what Magee's salary was considered to be on paper to bring him below the limit. I'll look into this hypothesis.
It'll be very interesting to see where the first free agents go. The literature on free agency predicts they should be more likely to go to teams in bigger cities where their financial impact is larger, teams on the verge of playoffs or Champions' League where their productivity could bump the team into that pool of revenue, and/or more amenable locations.
Saturday, October 17, 2015
MLS Shootout (part 2) - One Table to Rule Them All
The MLS shootout was introduced in 1996 to prevent American sports fans from suffering through a tied soccer game. The assumption was that we would prefer an NHL hockey-style shootout to a game without a winner and that we wouldn't mind becoming the laughing stock of the rest of the soccer world.
The reason for this is simple: since the top teams in each conference
gain entry to the post-season, teams are less averse to sharing points
when playing non-conference opponents. For example, when Columbus Crew
SC tied the Vancouver Whitecaps this past April,
the Crew didn't mind sharing points with a Western team. The point given away to
Vancouver had no bearing on the Crew's playoff chances since Vancouver
competes for spots in the Western Conference. However, the 3-3 draw
Columbus had with Toronto was less beneficial as it gave away a point
to Toronto, which remained 3 points behind Columbus in the
Eastern standings. So on net, Columbus gained no ground on Toronto
whereas the tie against Vancouver gained Columbus a point against all
Eastern teams.
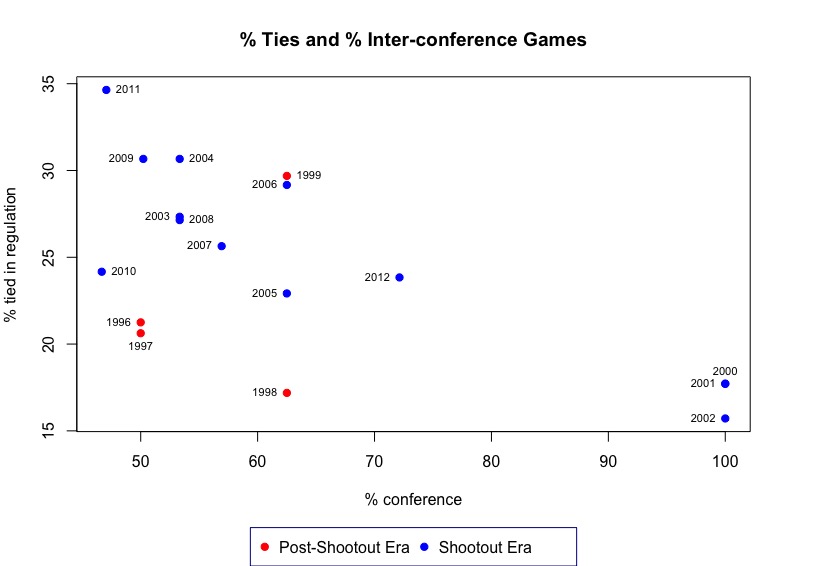
It stands to reason then that seasons with more inter-conference games should have less ties as teams fight harder to net 3 points (3 to them - 0 to opponent = 3 net points) instead of 0 (1 to them - 1 to opponent = 0 net points) against conference opponents. This has already been shown to be the case in NHL by Shmanske and Lowenthal (2007). But what about MLS?
Taking a look at the percent of tied games plotted against the percent of games played between opponents of the same conference for all non-shootout seasons, it seems that this is indeed the case. There is a clear downward trend indicating that the greater the percent of inter-conference games, the less the percent of tied games there will be.

Back to the shootout era. Adding these years to the plot, we see that outside of that crazy 1999 outlier season, the pattern still holds. Additionally, we see the effect the shootout had on tied games independent of conference effects. Again, outside of 1999, the shootout seasons saw a lower percentage of ties compared to other seasons with the same percent of inter-conference games.

So what can MLS do to minimize the amount of tied games we see? There
are two changes it could implement: a single table for playoffs and/or reintroduce the shootout. Although the latter would explicitly eliminate
ties as well as reduce the number of games that ended regulation in a
tie, I don't actually want to return to the shootout days. Neither does
MLS and neither do you. But a single table? When asked about the
possibility of a single table back in 2010, Don Garber replied
And if a single table is not in the works, we could theoretically baby-step our way to one by returning to the days when last playoff positions were given to the best teams regardless of conference (2007-2011). For example, in 2008 the top 3 teams in each conference were granted access to the playoffs along with the remaining top 2 teams regardless of conference. Although this yielded a strange situation where a team from New Jersey, the "New York" Red Bulls (NYRB), entered the playoff bracket in the West and was crowned the Western Conference Champions, it should have provided incentive for NYRB to give more effort against Western Conference teams during the regular season since they were competing for that last playoff spot with Western Conference teams.
Both Sporting Kansas City and NYRB had to earn more points than the 4 lowest ranked teams in the Western Conference to make the playoffs in 2008. Thus, their intra-conference games should have been given the same importance as their inter-conference games. The same should be true for all teams ranked around the last playoff spots and we should see more teams push for wins in closely fought games. Although this incentive should exist in theory, it's not blatantly obvious at first glance.

The years for which some teams are ranked on a single table to gain entry into the playoffs are represented by blue circles. The areas of the circles represent the proportion of teams that will make it to the playoffs via a single table comparison. The absolute number has been as few as 2 teams and as many as 10 teams. If the single table comparison caused more teams to push for wins in late tied games, we would see less ties when the circles are bigger and the circle years should be below the dots representing no single table comparisons. Unfortunately, the years that used a single table for some teams are not close to many comparison years in the plot for us to draw a conclusion.
Moving forward, I think things are complex enough that it's time to carry out a logistic regression on game level data so that we can simultaneously control for all the moving parts influencing tied games in MLS. These include but are not limited to, overtime structure, conference structure, playoff structure, and of course competitive balance within the league. Maybe then we can find out just what was going on in that 1999 season.
This project started out in my mind as a simple investigation of the incentive effects of the MLS shootout, a rare gem in soccer history. Upon diving into the data, it has become so much more. That is how research usually goes. And for all of my projects, you can replace the word "usually" with "always". But this is why you should choose topics you love. Then you don't mind so much when it takes 10 times as long as you thought it would.
Assuming a competitively balanced league where any team has an equal probability of winning, losing, or tying any game, I showed in the last post
that teams have less incentive to fight for a win in a late tied game now that there is no shootout. That is, teams are more likely to settle for a tie now that it guarantees a point. However, when looking at the percent
of tied games each season, it became clear that the jump in the percent
of tied games didn't occur immediately after the shootout era, which
ended after the 1999 season (see the reproduced graph below). If we
take a closer look at the data, we can see that the percent of games
ending in a tie has more to do with conferences and the rules of playoff
entry than shootouts.
 |
It stands to reason then that seasons with more inter-conference games should have less ties as teams fight harder to net 3 points (3 to them - 0 to opponent = 3 net points) instead of 0 (1 to them - 1 to opponent = 0 net points) against conference opponents. This has already been shown to be the case in NHL by Shmanske and Lowenthal (2007). But what about MLS?
Taking a look at the percent of tied games plotted against the percent of games played between opponents of the same conference for all non-shootout seasons, it seems that this is indeed the case. There is a clear downward trend indicating that the greater the percent of inter-conference games, the less the percent of tied games there will be.

What is up
with those outlier years with 100% of games being between same-conference teams you ask?
Although MLS actually had 3 "conferences" (East, Central, and West) for
the 2000-2001
seasons, entry into the playoffs was granted to the top two-thirds of
all teams regardless of conference. This was also true in 2002
although the league reverted back to 2 conferences (East and West). So
in practice the conferences only served as lists of teams that were
geographically close and played each other more often. This is why I'm
treating those years as if 100% of the games played were
inter-conference; for the sake of playoffs, they were.
You
have to appreciate the irony here. In the year where MLS seemed to
rebel once more against European football and create 4 team-conferences a
la the NFL, what it really had was a single table with an unbalanced
schedule. Single-table purists should add this fact to their arguments;
a single table should decrease the number of tied games in MLS.
Back to the shootout era. Adding these years to the plot, we see that outside of that crazy 1999 outlier season, the pattern still holds. Additionally, we see the effect the shootout had on tied games independent of conference effects. Again, outside of 1999, the shootout seasons saw a lower percentage of ties compared to other seasons with the same percent of inter-conference games.
...every year we do deeply analyze whether or not it makes sense for us to have a single table and no playoffs. We also evaluate whether it makes sense to have a single table and playoffs, or whether it makes sense to have conferences and playoffs.I have no idea what goes on when the top brass of MLS meet to deeply analyze using a single table. What I do know now is that the evidence above strongly suggests that doing so would reduce the number of ties. It would also appease the Eurosnobs out there who use words like "cappo" and refer to games as "matches" and fields as "pitches" and....ok I'm getting nauseous, enough.
...We're going to change it if we believe we could have a more compelling format and one that might be perhaps more balanced. ...It should be a format where there is more media coverage, more television ratings and more attendance as we get down to an event that is a single, stand-alone event, our championship game, the MLS Cup.
...All of those can happen within a single table format. The single table discussion is whether there is a single table or whether there are conferences?
And if a single table is not in the works, we could theoretically baby-step our way to one by returning to the days when last playoff positions were given to the best teams regardless of conference (2007-2011). For example, in 2008 the top 3 teams in each conference were granted access to the playoffs along with the remaining top 2 teams regardless of conference. Although this yielded a strange situation where a team from New Jersey, the "New York" Red Bulls (NYRB), entered the playoff bracket in the West and was crowned the Western Conference Champions, it should have provided incentive for NYRB to give more effort against Western Conference teams during the regular season since they were competing for that last playoff spot with Western Conference teams.
2008 MLS Standings
| Eastern Conference | Western Conference | ||
|---|---|---|---|
team
|
points
|
team
|
points
|
| Columbus Crew | 57 | Houston Dynamo | 51 |
| Chicago Fire | 46 | Chivas USA | 43 |
| New England Revolution | 43 | Real Salt Lake | 40 |
| Sporting Kansas City | 42 | Colorado Rapids | 38 |
| New York Red Bulls | 39 | FC Dallas | 36 |
| D.C. United | 37 | San Jose Earthquakes | 33 |
| Toronto FC | 35 | LA Galaxy | 33 |
*teams in bold admitted to playoffs
Both Sporting Kansas City and NYRB had to earn more points than the 4 lowest ranked teams in the Western Conference to make the playoffs in 2008. Thus, their intra-conference games should have been given the same importance as their inter-conference games. The same should be true for all teams ranked around the last playoff spots and we should see more teams push for wins in closely fought games. Although this incentive should exist in theory, it's not blatantly obvious at first glance.

Moving forward, I think things are complex enough that it's time to carry out a logistic regression on game level data so that we can simultaneously control for all the moving parts influencing tied games in MLS. These include but are not limited to, overtime structure, conference structure, playoff structure, and of course competitive balance within the league. Maybe then we can find out just what was going on in that 1999 season.
This project started out in my mind as a simple investigation of the incentive effects of the MLS shootout, a rare gem in soccer history. Upon diving into the data, it has become so much more. That is how research usually goes. And for all of my projects, you can replace the word "usually" with "always". But this is why you should choose topics you love. Then you don't mind so much when it takes 10 times as long as you thought it would.
Monday, October 5, 2015
The MLS Shootout (Part I) - Fast Kicking, Low Scoring, and Ties? You Bet!
American sports fans aren't known for their love of tied games. Other than MLS, the NFL is the only league to currently allow games to end in a tie and we usually go an entire season without even one tied game. Fearing that Americans couldn't support a soccer league with games that frequently ended in a draw, MLS initially decided to end all tied games with a shootout in its inaugural season. Not the penalty shootouts you're use to seeing in the World Cup or UEFA mind you, but more like a NHL-style shootout where players charge at the keeper and try to get a shot off before the 5-second clock runs out. Because that would be more American. For those of you who didn't have the pleasure to see one of these in person, by the magic of Youtube, you still can.
Now this is clearly a sub-optimal way to decide a winner. MLS did at least try to dissuade games from ending this way by awarding 3 points for a win in regulation and only 1 point for a shootout victory. So were Americans more entertained by a NHL-style shootout? Did less games end in a tie? Should we have expected them to?
The answer to the first question is of course subjective but my guess is that the answer is a resounding "no". Otherwise, we'd still have the shootout. To answer if less game ended in a tie and whether or not we should expect them to, we can turn to the data and probability theory. Let's first see what we should expect to happen with a shootout.
Consider, as we did in the last post, a league where all teams are of equal strength and the likelihood of any team winning, losing, or tying a game is equal to 1/3. Now with shootouts, when a game in regulation is tied each team will have a 50% chance to win the shootout. So we have 4 possible outcomes for any given team, they can win, lose, win in a shootout, or lose in a shootout. The probabilities for the outcomes are PW=PL=1/3 and PSOW=PSOL=1/6. So we can model the outcomes of the games as draws from a multinomial distribution with four outcomes. Of course these probabilities are somewhat arbitrary. We could just as easily assume any numbers where PW=PL and PSOW=PSOL and still have an ideal competitive league. The probabilities chosen are simply for ease of illustration.
To be specific, the probability density function (pdf) of points is
Before any game, a team can expect
with a variance of
so that
If a game is tied in regulation, then each team has a 50% chance of winning or losing and the conditional expectation becomes
with a variance of
so that
The expected points earned in a shootout is much less than in regulation but does have a lower variance. So although the expected payoff in a shootout is lower, it is more certain. However, given the large difference in expected outcomes, a team would have to be severely risk averse to prefer to end a game in a shootout. Or, abstracting from both teams being of equal strength, one team would have to believe it had a very low chance of winning in regulation to prefer the shootout. There may be evidence that this is what the San Jose Clash were thinking in 1999 with their record 13 shootouts (more on that later).
So did this setup give teams incentive to try to win in regulation and avoid shootouts altogether? Let's look at what the distributions for expected points are for games are now without the shootout. We can repeat the process above for the situation where teams can win, lose, or tie with equal probability (1/3). Or we could just plug in a value of 1 game played (gp=1) in the calculation we did in the last post. Either way, we'll get
and of course if a game ends in a tie, each team gets a guaranteed 1 point with 0 variance. Now let's look at this all in a convenient table.
As we can see from the first 3 columns of data, the expected points earned when going from regulation to a shootout decreases by two-thirds (-0.667) and the outcome is much more certain. In the last 3 columns, we see that the decrease in expected points after regulation is half that of the shootout era (-0.333 vs. -0.666)! Furthermore, it's a guaranteed outcome of 1 point each. So having a tied game in regulation loses less points in expectation without the shootout. Saying it another way, teams have less incentive to avoid tied games when there is no shootout. So it seems the answer to the question of whether we should expect less ties in the shootout era is, yes. The payoff structure did suit the game well for avoiding games that were tied in regulation. But did it actually work?

You can recreate the graphs using this data and this R script.
While the graph above indicates that games were less likely in the initial years to end in a tie after 90 minutes, the switch doesn't seem to perfectly coincide with the end of the shootout era, which lasted from 1996 to 1999. So although the answer to our question of whether there was actually a higher chance of ending a game in regulation during the shootout era is "yes", we now have new questions that need to be answered. What is going on in 1999 that there were so many games going to shootout? And more importantly, why does the jump in games tied in regulation occur in 2003 and not immediately after the shootout era?
For a hint, below is the same graph with lines drawn around the period of time for which MLS essentially had a single table. I say "essentially" because there were actually multiple conferences during this time but entry into the playoffs was granted to the top 8 teams regardless of conference. This led to a somewhat odd situation where the entire Western Conference made the playoffs in 2002.

We'll dig into why divisions matter when it comes to whether or not games end in a tie next time. Until then, I'll leave you with pop culture's initial reaction to MLS a la The Simpsons.
| Regulation (SO) | Shootout | Difference (SO) | Regulation (Ties) | Tie | Difference (Ties) | |
|---|---|---|---|---|---|---|
| Expected Value | 1.167 | 0.50 | -0.667 | 1.333 | 1.000 | -0.333 |
| Variance | 1.806 | 0.250 | -1.556 | 1.556 | 0 | -1.556 |
As we can see from the first 3 columns of data, the expected points earned when going from regulation to a shootout decreases by two-thirds (-0.667) and the outcome is much more certain. In the last 3 columns, we see that the decrease in expected points after regulation is half that of the shootout era (-0.333 vs. -0.666)! Furthermore, it's a guaranteed outcome of 1 point each. So having a tied game in regulation loses less points in expectation without the shootout. Saying it another way, teams have less incentive to avoid tied games when there is no shootout. So it seems the answer to the question of whether we should expect less ties in the shootout era is, yes. The payoff structure did suit the game well for avoiding games that were tied in regulation. But did it actually work?

You can recreate the graphs using this data and this R script.
While the graph above indicates that games were less likely in the initial years to end in a tie after 90 minutes, the switch doesn't seem to perfectly coincide with the end of the shootout era, which lasted from 1996 to 1999. So although the answer to our question of whether there was actually a higher chance of ending a game in regulation during the shootout era is "yes", we now have new questions that need to be answered. What is going on in 1999 that there were so many games going to shootout? And more importantly, why does the jump in games tied in regulation occur in 2003 and not immediately after the shootout era?
For a hint, below is the same graph with lines drawn around the period of time for which MLS essentially had a single table. I say "essentially" because there were actually multiple conferences during this time but entry into the playoffs was granted to the top 8 teams regardless of conference. This led to a somewhat odd situation where the entire Western Conference made the playoffs in 2002.

Subscribe to:
Posts (Atom)